

Transforming Climate Scenario Modified Streamflows from Daily Flows to Average Weekly Flows for Inputs into Redeveloped GENESYS
This section contains descriptions of the R-script that transforms the daily climate scenario modified streamflows developed by the River Management Joint Operating Committee (RMJOC) into average weekly modified streamflows for input into the redeveloped GENESYS.
A portion of the daily modified streamflows for climate scenario G (see summary of climate change scenarios) for the years 2019 to 2049 is presented in Figure 1.
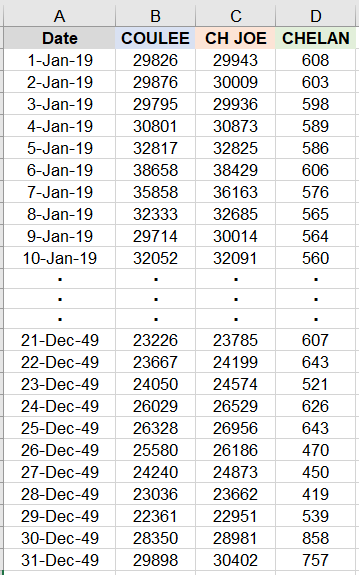
Figure 1: A portion of the daily modified flows for climate scenario G for 2019 to 2049.
In Figure 1, column A lists the dates for the modified streamflows, in units of CFS, for Grand Coulee, Chief Joseph and Chelan dams in columns B to D respectively. In the redeveloped GENESYS, abbreviated names for used for some of the dams. For example, COULEE (column B) represents Grand Coulee and CH JOE (column C) represents Chief Joseph. The 3 hydro-projects in Figure 1 are among 72 hydro-projects modeled in the redeveloped GENESYS.
For the three sets of daily streamflows in columns B to D, the R-script then calculates their corresponding weekly averaged streamflows. More specifically, the 1st week begins on January 1 and ends on January 7; the 2nd week begins on January 8 and ends on January 14, and so on. However, the 9th week begins on February 26 and ends on March 4, even for leap years. Thus, the leap day February 29 is skipped and streamflows for the leap day are not included in the weekly averaging. Moreover, the 40th week begins on October 1 which also corresponds to the beginning of a water-year. Finally, the 52nd week begins on December 24 and ends on December 30. Therefore, December 31 is also skipped and streamflows for the last day of the calendar year are not included in the weekly averaging. The results of the weekly averaging are presented in Figure 2.
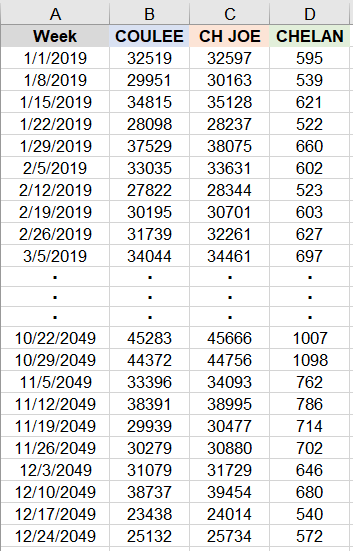
Figure 2: The weekly averaged flows calculated from the three daily modified streamflows in Figure 1.
In Figure 2, column A lists the first day of the week for the weekly averaged modified streamflows for Grand Coulee, Chief Joseph, and Chelan dams in columns B to D respectively. The three weekly averaged flows are calculated from their corresponding daily modified streamflows in Figure 1.
For example, on the first row of column B in Figure 2, the COULEE average modified streamflow for the 1st week of January 2019 is 32,519 CFS which is the average of the COULEE daily modified flows for the 7 days from 1-Jan-19 to 7-Jan-19 in Figure 1. Similarly, on the last row of column B in Figure 2, the COULEE average modified streamflow for the last week of December 2049 is 25,132 CFS which is the average of the COULEE daily modified flows for the 7 days from 24-Dec-49 to 30-Dec-49 in Figure 1.
The weekly averaged modified streamflows (for climate scenario G) for the 3 projects in Figure 2 and the other 69 hydro-projects (not shown) become inputs into the redeveloped GENESYS model.