The key economic driver for the commercial sector’s energy demand is the square footage needed for commercial enterprises. In modeling this sector, the Council calculated the space requirement of thousands of business activities and aggregated these into 17 different building types.
Estimating Current Commercial Floor Space
To understand the future floor space requirements in the commercial sector, we first need to establish the existing building stock. The Northwest Energy Efficiency Alliance (NEEA) completes market research on the commercial building stock in the region, the most recent published report being from 2014. NEEA’s market research report[1] estimated that for 2014 the total commercial floor space in the Pacific Northwest was 3.34 billion square feet. The estimated distribution of this floor space across states and building types is shown in Table below.
2014 Commercial Building Stock (Millions of Sq. Feet)
| Idaho | Montana | Oregon | Washington | Total | |
| Office | 57 | 45 | 185 | 447 | 734 |
| Retail | 57 | 65 | 142 | 307 | 571 |
| Hospital | 15 | 14 | 26 | 49 | 104 |
| Elder Care facilities | 7 | 7 | 44 | 68 | 125 |
| Hotel | 10 | 16 | 33 | 112 | 171 |
| Restaurant | 3 | 9 | 13 | 28 | 53 |
| Grocery | 4 | 6 | 19 | 38 | 66 |
| Minimart | 1 | 1 | 2 | 7 | 11 |
| K-12 | 13 | 11 | 81 | 141 | 245 |
| University | 17 | 8 | 37 | 61 | 124 |
| Warehouse | 32 | 31 | 131 | 248 | 442 |
| Assembly | 25 | 26 | 122 | 196 | 369 |
| Other | 38 | 26 | 146 | 122 | 333 |
| Grand Total | 278 | 266 | 982 | 1,822 | 3,349 |
Square Footage per Employee
One method of projecting the future floor space required is to look at the square footage per employee for different types of businesses in the commercial sector and use forecasted employment trends to project the future need for space. To establish the baseline amount of space per employee by business type, we use the Department of Energy’s Commercial Building Energy Consumption Survey data (micro-data from a national survey of over 21,000 commercial buildings surveyed between 1992 and 2003).
Median Square Footage per Employee by Business Type

Forecasting Commercial Floor Space Requirements
Putting together a forecast of the future need for commercial floor space requires some way of projecting future business activities for the region. We know that different types of commercial businesses use different amounts of space. Looking at the historic data we have found a strong relationship between the total amount of space needed for various business activities and the number of employees working in those same activities.
To establish an estimate of the future need for commercial floor space, we first get the best estimate of the current floor space dedicated to the different types of businesses and the current employees working at these businesses. That helps us get an estimate of the average floor space needed per employee for different types of commercial businesses. Then we look at projections for the future number of employees in the region and derive the estimated need for commercial floor space from the projected employment trends.
Commercial Employment Projections
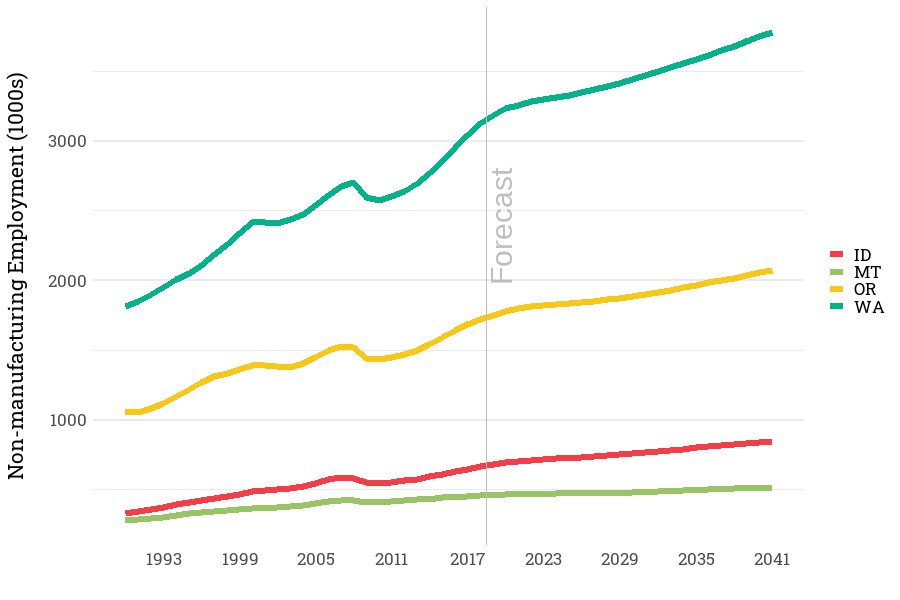
To establish projections of future employment, the Council used Global Insight’s business demographic forecast of employment. This shows total employment climbing from around 6 million non-manufacturing jobs today to more than 7.2 million non-manufacturing jobs by 2041.
Commercial Employment Projection by State
Changing Composition of Commercial Sector
The market share of business activity employment in the commercial sector has not been constant. Over the past 17 years, some business sectors have increased their share of total employment, while other sectors experienced a declining share employment. For example, businesses engaged in health care, information technologies, professional and technical services, and wholesale trade services have increased their share of total employment, while government and retail trade have reduced their share.
Market Share of Employment by Business Type
| 2022 | 2025 | 2041 | |
| Accommodation and Food Services | 10% | 9% | 9% |
| Administrative and Support and Waste Management and Remediation Services | 7% | 7% | 8% |
| Arts, Entertainment, and Recreation | 2% | 2% | 2% |
| Construction | 7% | 7% | 8% |
| Educational Services | 2% | 2% | 1% |
| Finance and Insurance | 3% | 3% | 3% |
| Health Care and Social Assistance | 14% | 15% | 16% |
| Information | 3% | 3% | 3% |
| Management of Companies and Enterprises | 2% | 2% | 1% |
| Professional, Scientific, and Technical Services | 7% | 7% | 7% |
| Public Administration | 19% | 19% | 18% |
| Real Estate and Rental and Leasing | 2% | 2% | 2% |
| Retail Trade | 12% | 12% | 11% |
| Transportation and Warehousing | 3% | 3% | 3% |
| Utilities | 0% | 0% | 0% |
| Wholesale Trade | 4% | 4% | 4% |
| Other Services (except Public Administration) | 4% | 4% | 3% |
| Grand Total | 100% | 100% | 100% |
Using these projections, we see different relative increases in the space requirements for commercial businesses. For example, between 2018 and 2040 we project a large increase in the need for retail space and office space, but a relatively modest increase in the need for space for restaurants and grocery stores. Note that floorspace requirements are not the same as commercial floorspace additions. Floorspace requirements, reflect needed space for conducting commercial business.
Commercial Floor Space Requirements by Building Type

Combining these together we project an increase in commercial square footage of around 1 billion square feet in the region by 2041 ending up with just over 4.6 billion square feet of commercial floor space.
Commercial Building Stock
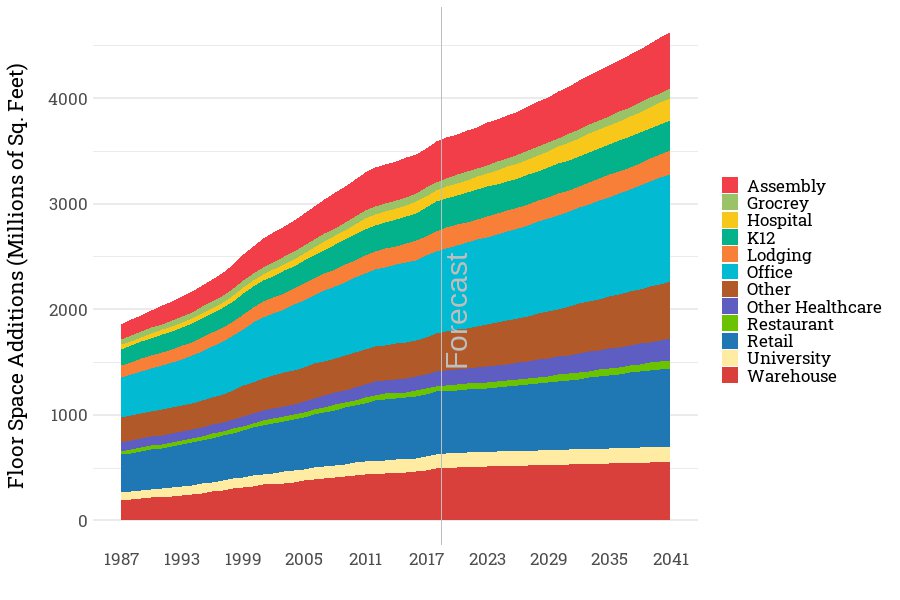
While this forecast shows an annual growth rate of around 1.11% in regional commercial floor space, that is a slower growth rate than previous plan projections.
Average Annual Growth Rate in Commercial Floor Space from Past Plans
| 6th Plan (2010-2030) | 7th Plan (2015-2035) | 2021 Plan | |
| Average Annual Growth Rate | 1.25% | 1.20% | 1.11% |
Commercial Floor Space Addition Requirements
Commercial floor space additions typically show a cyclical pattern of overbuilding followed by high occupancy and demand for more space. This is especially true for the more speculative building types such as office or retail. A sharp increase in added floor space in late 1980s was followed by a significant slowdown in the early 1990s. The late 1990s then again had a sharp increase in new construction activities which was slowed by the 2000-2002 recession. In 2005, another wave of commercial construction took place. Due to the long construction time for commercial activities, it would typically take a year or two for construction activities to reflect the economy. Recent years again show an increase in construction activities.
Total Commercial Floor Space Requirement Additions
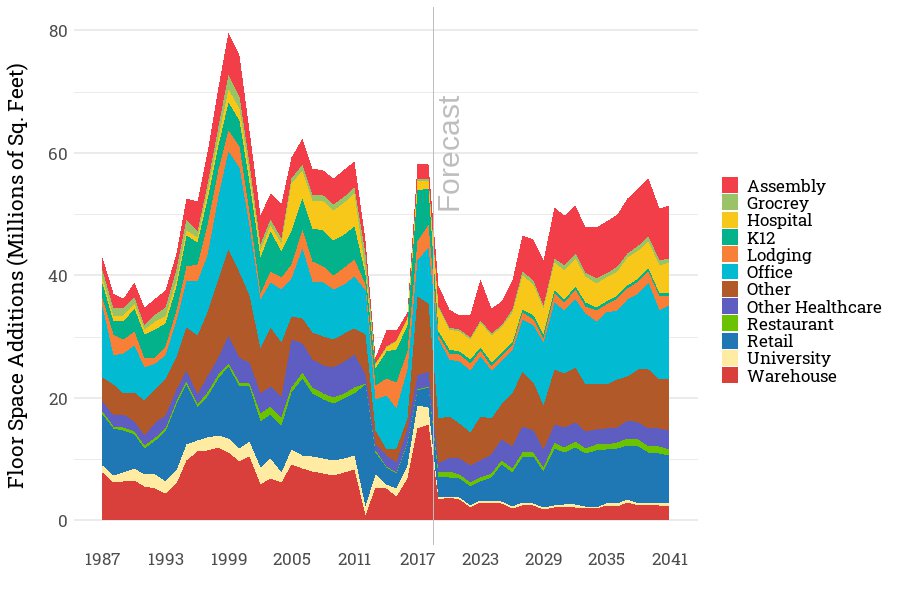
Since recovery from recession, our current estimates show an average annual addition to floor space of about 51 million square feet. During Action Plan period, 2022-2027 we expect a more moderate annual additions of about 38 million square feet. The longer-term forecast for floor space additions do show a wide swing in construction activities. However, these swings in construction activity are not due to business cycles but rather due to changing demographics and changing commercial trends.
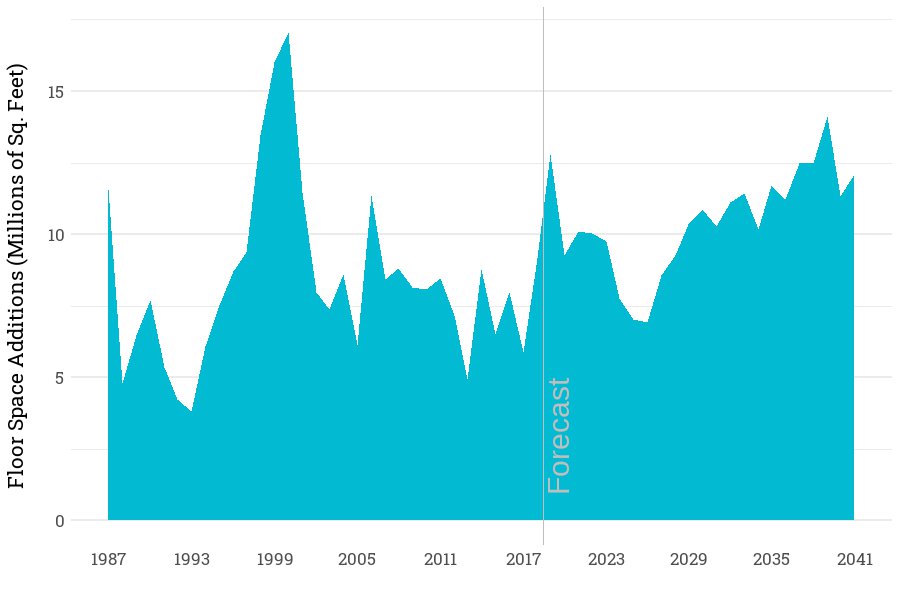
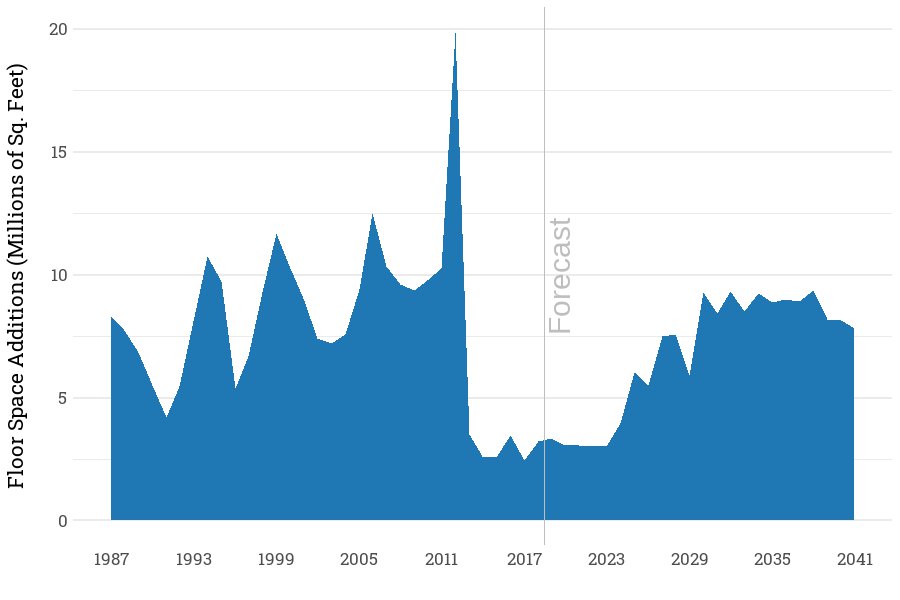
An example of this is office floor space. Employment projections suggest a more moderate additional need for new office space from 2020 to 2025. Starting in 2027, employment projections show an escalation of commercial office requirements.
Office Space Requirements
Whereas we forecast a substantially lower number of retail space additions from 2022 to 2027. This reflects slower population growth and the move to e-commerce.
Retail Space Requirements
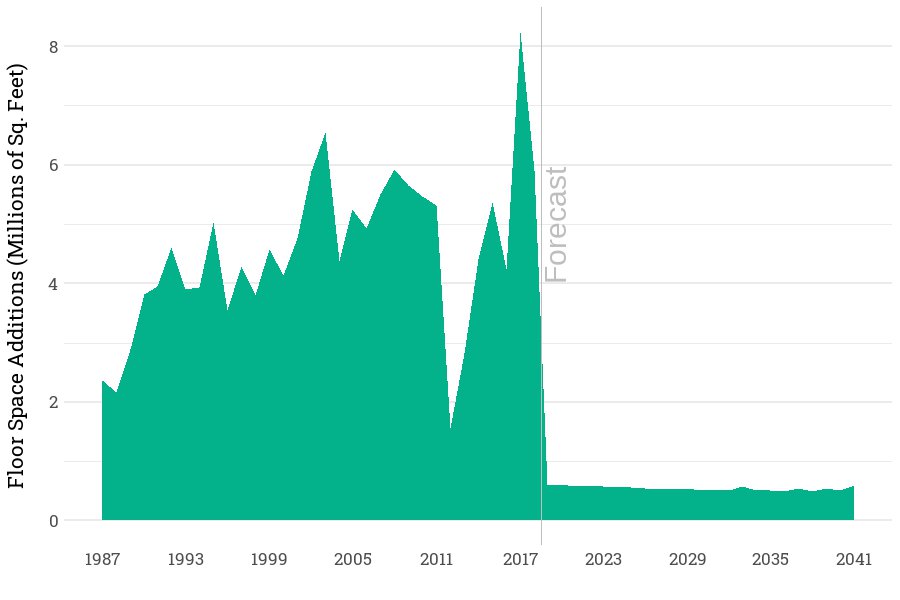
While additions of commercial floorspace for offices and retail are examples of space driven by economic conditions, there are also changes in commercial space that are driven by population demographics. Population in the region is growing at a slower rate and the population is greying. An example of this is the need for additional K-12 school space. We seem minimal additions needed in the region which reflects the declining share of the population under 19 years old.
K-12 School Space Requirements
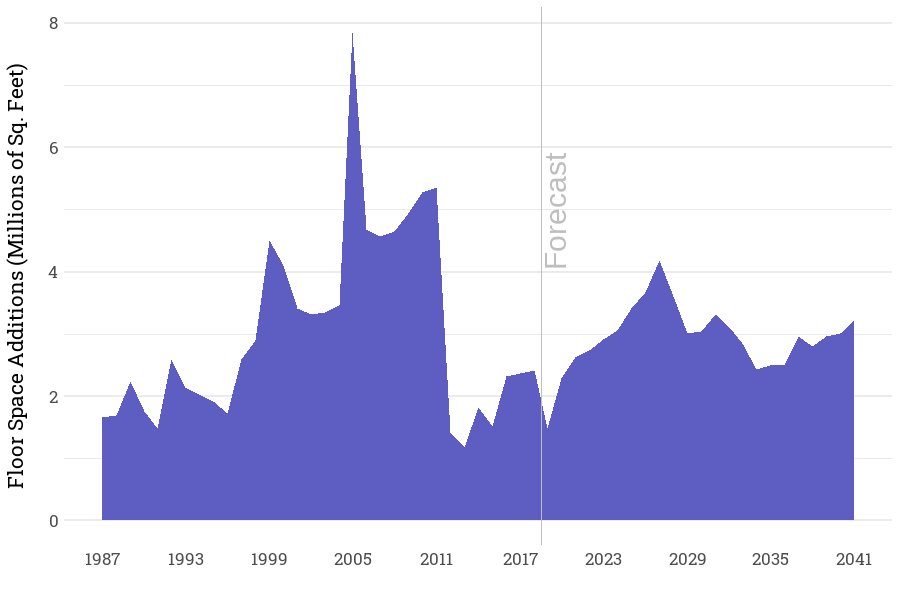
Whereas the need for healthcare facilities that are not hospitals is growing rapidly based on addition space needed for eldercare facilities. The elderly population, 85 plus, most likely needing specialized care facilities, is increasing from about 100 thousand in 1985 to about 660 thousand by 2040. Post the 2008 recessionary period we saw a significant increase in new facilities targeting this population segment. We expect space requirements to continue to grow at a strong pace.
Other Healthcare Space Requirements
Methodology in Estimating Commercial Floor Space Requirements
The key driver for the commercial sector is the stock square footage required to conduct business activities in designated building types. To calculate this square footage, the Council developed a simple model that uses the number of employees per business activity and median square footage per building type with the following analytic steps:
- The Bureau of Labor Statistics (Quarterly Census of Employment and Wages) provides the number of establishments[2] and employees at the end of 2013 (at 6-digit NAICS[3] code level). This enabled a detailed investigation of the type of business activities and the number of employees for each business type. Each business activity was assigned one of the 17 commercial building types used in load forecasting and the demand response and energy efficiency assessments.
- The median square footage per main-shift employees (the hours of 8 a.m.-5 p.m.) for various business activities are reported as part of Commercial Building Energy Consumption Surveys (CBECS 2012) from the U.S. Energy Information Administration.
- CBECS micro data (individual site data) for 1992-2003 for more than 21,000 buildings are used to calculate the median square footage per employee and the number of hours of operation for various establishments.
- The Bureau of Labor Statistics provides the percent of “major” occupation categories engaged in a business activity (at 4-digit NAICS). http:/stat.bls.gov/oes/home.htm
- An estimate of existing floor space stock and the demolition rate by building type from the latest Commercial Building Stock Assessment (CBSA).[4]
- Floor space additions for each building type for 2014-2017 from F.W. Dodge are used to augment the building floor space stock to create an assessment of the existing floor space in 2017. This floor space stock was reduced by calculated demolitions during 2002-2017.
- An initial, 2018 estimate of floorspace requirements for each business activity was estimated using the following factors:
- The assigned building types
- Median square footage per employee
- Number of employees
- Percent of business activity engaged in an occupation
- The estimated 2018 floor space stock for each business activity will be adjusted so that the total square footage for that building type is close to the benchmark floor space stock in 2018, once data from latest CBSA becomes available.
- Future floor space requirements were forecast by applying the annual growth rate in employment in each business activity to Global Insight’s forecast (at state, and 4-digit NAICS code level), and to the 2018 floor space requirements for that business activity.
- For each year, the new floor space requirements across business activities were aggregated by building type, and for each building type, a portion of floor stock is estimated to be demolished.
- For years 2020-2050, the estimated commercial floor space stock is fed into the demand forecasting model.
Analytic Steps in Forecasting Floor Space for Each State

[1] “Assessment of the Commercial Building Stock in the Pacific Northwest” March 2014,
[2] Establishment - A single physical location where business is conducted or where services or industrial operations are performed.
[3] NAICS - North American Industrial Classification System


