Mapping the Northwest’s Power Supply
Council unveils online tool to explore energy development in the region
- January 11, 2018
- Carol Winkel

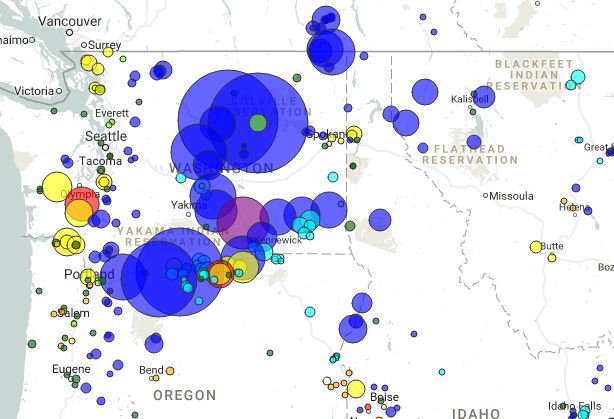
At the Council's January meeting Gillian Charles presented an update on the region's generating resource development and demonstrated, with Eric Schrepel, an enhanced online mapping tool to learn about resources and trends.
The hydropower system continues to be the foundation of the Northwest's power supply, supplying roughly 50 percent of the region's generation. Energy efficiency supplies 20 percent and is the region's second largest resource. Because of this, the region's annual carbon emissions from the power system is lower compared to the country. As lower-cost natural gas has edged out coal as the preferred fuel, emissions have trended down in recent years.
Renewable resource development (renewables are now 10 percent of the region's power supply) has slowed since utilities have met their near-term renewable standard obligations and developers were uncertain if Congress would extend the federal tax incentives for renewables. The final tax bill largely preserves incentives for wind and solar power.
Still, interest in solar PV development is strong for utilities wanting to diversify their resource mix. Costs for solar PV have dropped, making it competitive with wind and other resources, and areas in southern Idaho and eastern Oregon are favorable locations for solar.
Charles also noted that battery energy storage pilot projects are also on the horizon, which will help to address the intermittency problems with renewables.

The mapping tool gives users access to the latest information about existing and planned resources and the ability to filter projects by resource, size, and operating year. It can also show how the power supply has changed over time; what resources have been developed and where. The Council maintains a robust project database used by regional and national stakeholders, and the enhanced online map will help make the data even more useful to more people.


